
Robust interest by shoppers in consuming more protein represents a key opportunity to continue...
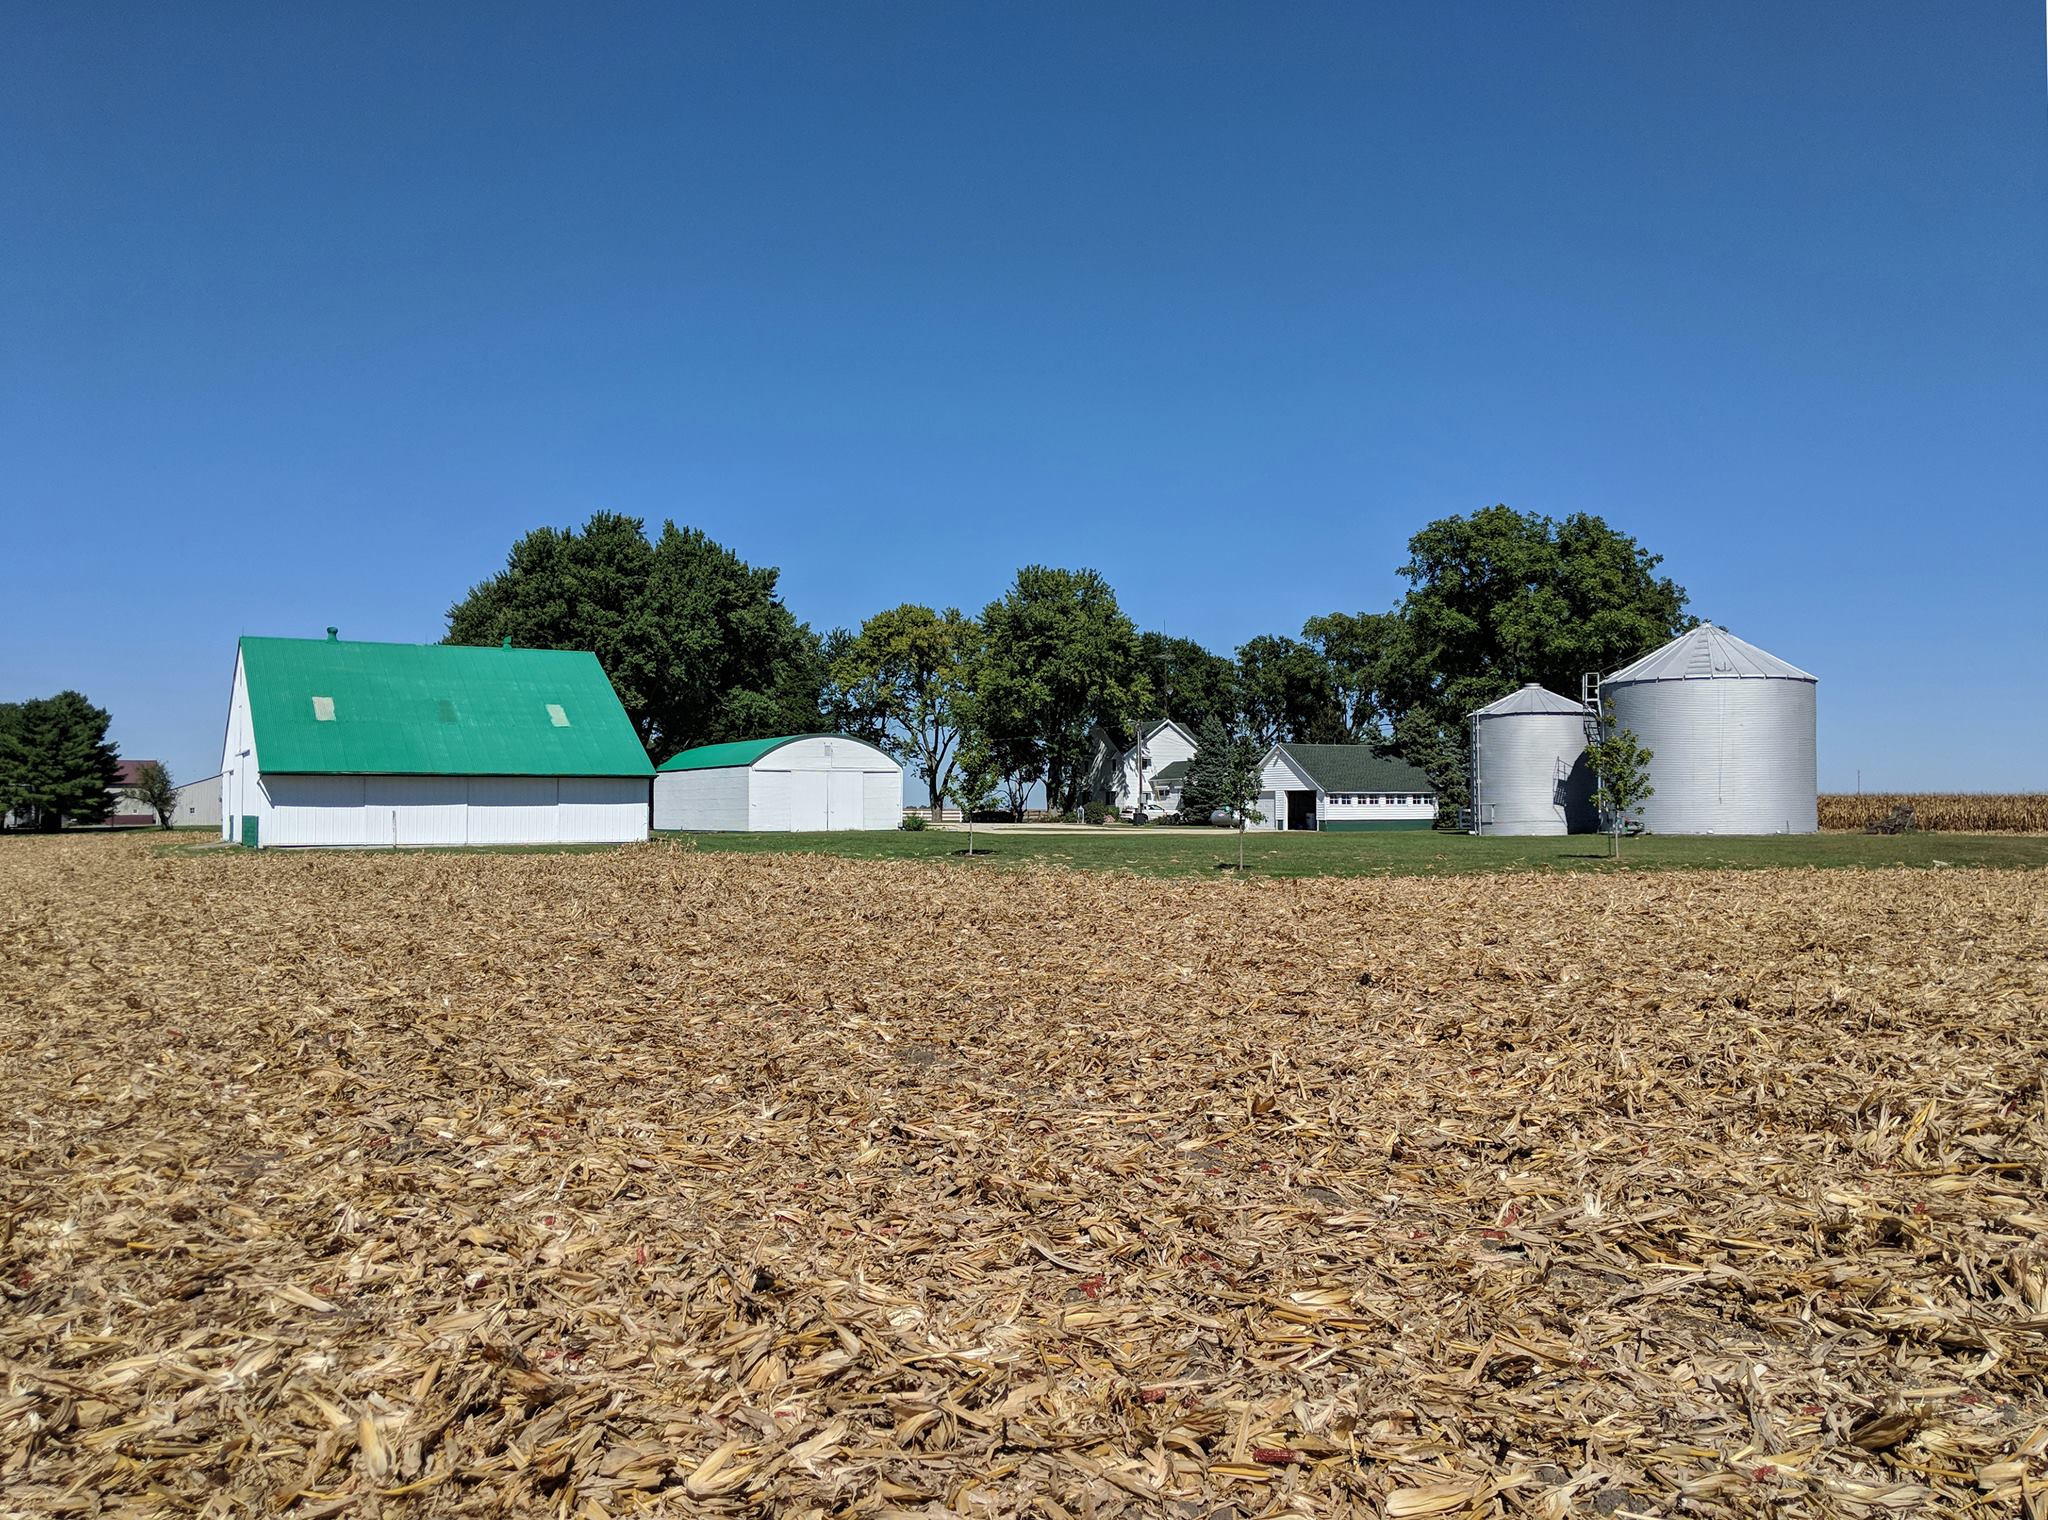
The USDA’s latest farm income data include state-level farm income estimates. While the latest state-level data are only available through 2025, the lagged data still reveal where farm financial pressures have been most challenging.
Where incomes have fallen the most
Figure 1 shows 2025 net farm income compared to the 2022 – 2023 average. Not surprisingly, many states are shaded red, but Illinois stands out. In 2025, net farm income across Illinois farms was estimated to be 57% lower than in 2022-2023.
Part of what makes Illinois stand out is that the contraction was much greater than observed in neighboring “I-states.” While deviations in annual production would explain some of the variation, the role of animal agriculture in the state’s economy shouldn’t be overlooked. Even in the Corn Belt, livestock’s share of farm production varies considerably as one moves from Iowa (45%) to Illinois (14%) and Indiana (34%).
Elsewhere in the Midwest, net farm income was also considerably lower in North Dakota (-47%) and Minnesota (-34%).
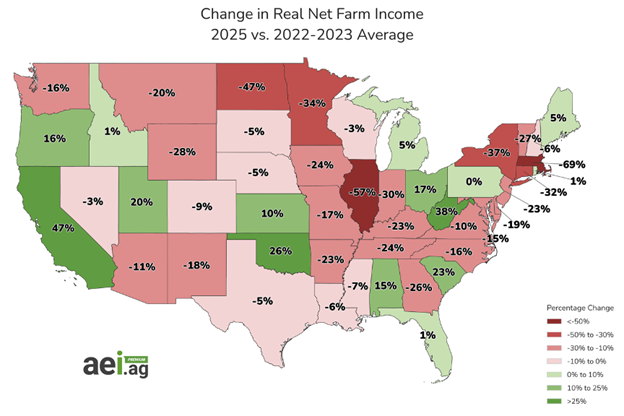
Figure 1. Change in real net farm income, 2025 versus 2022-2023 average, 2026$. Data sources: USDA ERS and AEI.ag calculations.
A longer-run perspective
Given the cyclical nature of the farm economy in recent years, a large decline doesn’t necessarily mean recent conditions have been historically weak. Figure 2 provides that context by comparing the average net farm income in 2024-2025 with each state’s 2010-2025 average. A value of 100% means income matches the long-run average, while values above or below 100% reveal the deviation from the baseline.
While many Great Plains states report values above 100% (meaning recent net farm incomes have been above the long-run, inflation-adjusted average), conditions have been especially favorable in Texas. At 169%, recent net farm income was 69% higher than the 16-year baseline. Other states with high recent net farm incomes include Utah (155% of the baseline) and West Virginia (214% of the baseline).
At the other extreme, a handful of states are well below the baseline average. With this measure, Illinois net farm income is 83% of the baseline, while Minnesota (74%) and Tennessee (88%) are also below their long-run averages.
Lastly, another standout is Washington. In that case, net farm income fell sharply in 2024 due to soaring contract labor expense. While incomes were higher in 2025, they also remained below the long-run average as the value of crop production has trended lower for the state.
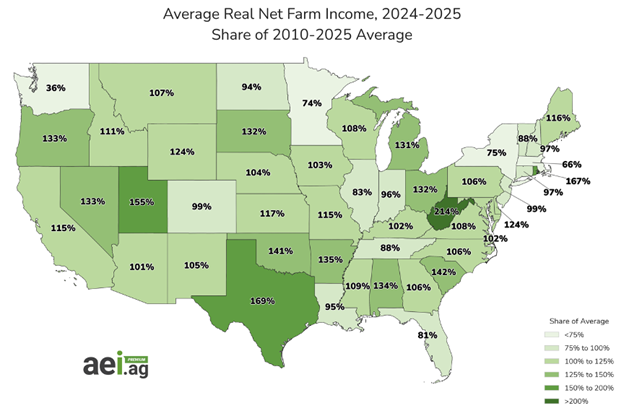 Figure 2. Average 2024-2025 real net farm income as a share of 2010-2025 average, 2026$. Data sources: USDA ERS and AEI.ag calculations.
Conditions across the farm economy have been hard to summarize, as crop producers have faced considerably different economic conditions than livestock producers. Even states in a similar region can have dramatically different conditions.
In conclusion, Illinois, Minnesota, and North Dakota have been among the hardest hit in recent years. Elsewhere, net farm income has been soft in the Northeast, including New York, and in Washington.
EDITOR’S TAKE:
It is not clear from this article whether government payments were included in the analysis or not, but one thing is clear, many states have maintained net farm income above the long-term average. That is especially true for states where livestock plays a key role in their ag economy or they have a higher than average specialty crop mix. What is also clear is that states depending on higher percentages of row crop production have been the hardest hit.
What does all this mean for your dealership? Depending on the state you operate in, farmers/ranchers may be experiencing higher operating costs; some states have even seen below long-term trend for net income. That said, looking at the map in figure 2, you should definitely keep them at the top of your customer prospect list in a vast majority of states. In the case of those states experiencing tougher financial issues, put more emphasis on AgPack®. Your AgPack partners are offering nearly $50,000 in exclusive rebates and discounts that will help farmers/ranchers lower their operating costs!