What to do when your major adversary is also your biggest customer?
China’s Hoard of Global Crop Inventories

Attention has recently focused on China’s inventories and export restrictions on rare-earth materials. The developments threatened to send trade tensions to a full boil, and one eye-catching summary of the conditions is that China accounts for 70% of rare-earth mining and 90% of processing. To be clear, the rare-earth metals are a group of seventeen elements used in the production of tech-focused products, including magnets, lasers, and electronic components.
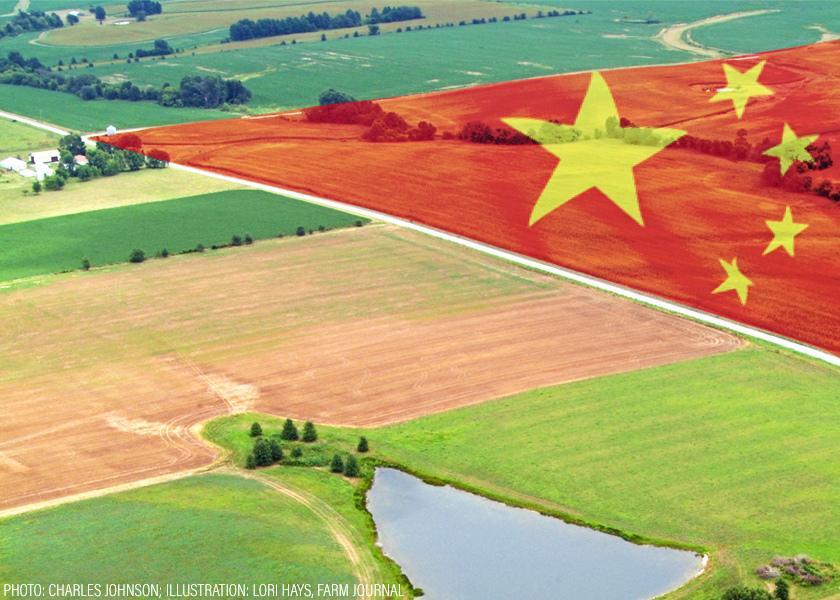
Closer to the farm, China also has a hoard of crop inventories.
Crop inventories are hard to “add up” because a bushel of corn, a bushel of soybeans, and a bale of cotton aren’t directly comparable. To create a unit that can be meaningfully aggregated across the thirteen principal crops, ending stocks can be converted to acre-equivalents of production.
For the 2025/26 marketing year, China’s crop ending stocks are equal to an estimated 278m acres of production. By comparison, the U.S. will have around 40m acres’ worth.
Figure 1 shows China’s stocks as a share of the global total. Since 2019, China has accounted for nearly half of the world’s total crop inventories. While this share is expected to decline slightly in 2025/26, likely due to the quiet embargo of U.S. ag purchases, China’s crop piles will still be 47% of the global total.

Figure 1. China’s crop ending stocks as a share of global stocks, on a harvested-acre basis, 1970 to 2025. Data source: USDA FAS and AEI.ag calculations.
Digging into the details, Figure 2 shows how those 278m acres’ worth of stocks are distributed across five key commodities. Together, corn and soybeans account for 158m acres, making up the majority of China’s inventories. These two crops also saw the largest build-up in stocks between 2010 and 2020 but have trended lower in recent years.
China’s ending stocks for soybeans are an estimated 37m acres. While this is considerably higher than the 20m acres maintained prior to 2020, levels are forecasted to remain mostly unchanged going into 2025/26.

Figure 2. China’s ending stocks of select crops, acre-equivalents, 2010 to 2025. Data source: USDA FAS and AEI.ag calculations.
Wrapping it up
Naturally, these charts tend to generate questions about the accuracy of the data and China’s broader intentions. The key takeaways are:
- China’s crop stocks have fluctuated considerably over the last thirty years. As such, it’s hard to define a “normal” policy or expectation.
- Recently, China’s stocks, which aren’t readily available for global trade, have accounted for nearly half of all crop ending stocks.
- China may be well-positioned to be picky about its agricultural trade partners in the next handful of years.
One major difference between rare-earth metals and agricultural commodities is that China is a net importer of crops. This dynamic explains why U.S. agriculture finds itself caught in the geopolitical crossfire.
EDITOR’S TAKE:
After several trips to China over the years, this editor completely comprehends why reliable statistics are difficult to obtain regarding their inventories. It is also easy to understand why they maintain such massive stockpiles. Why? Because they have a massive population and not enough arable land to grow what they need. If they don’t keep the masses fed, rulers will get tossed. Those huge inventories of grain and other commodities also put them in the driver's seat when it comes to purchasing agricultural products. For all those reasons and the fact that they don’t have very good record keeping systems, one should not put full trust into their data.
But don’t let your inventory of trucks pile up. Make sure you keep those listings on AgTruckTrader.com® up to date. Also, now is the time to promote AgPack® with up to nearly $50,000 in exclusive rebates and discounts. AgPack® offers farmers/ranchers a way to lower their operating costs and show a return on their truck investment.


