

The farmland market is expected to remain strong going into 2023. Compeer Financial Senior Real...
The USDA’s latest estimates reveal that U.S. cropland values average $6,020 per acre in 2026 (Figure 1). However, that national average often isn’t, on its own, very insightful. Instead, year-over-year, state-level data provide meaningful context.
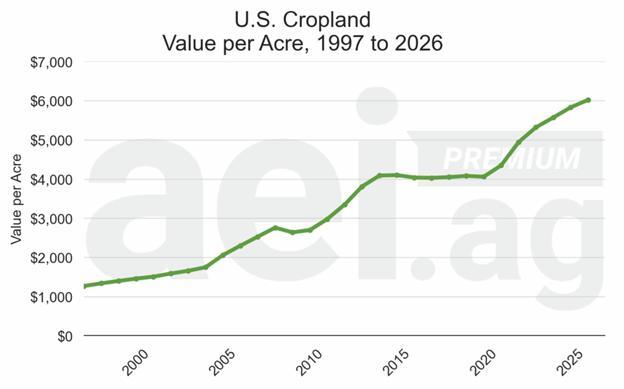 Figure 1. Value of U.S. cropland, 1997 to 2026. Data source: USDA NASS.
Year-over-year changes
Figure 2 plots the annual change in average cropland values since 1997. For 2026, the increase was 3.3%, which is considerably less aggressive than the increases observed in recent years. For instance, cropland values increased 4.7% in both 2024 and 2025. Also, values increased nearly 14% in 2022.
While cropland values are increasing at a slower rate, it’s probably premature to say values are stable or have plateaued. The 2014-2020 farm income slump provides a useful comparison. Cropland values experienced six years of very small or negative annual changes. More specifically, cropland values averaged $4,090 per acre in 2014. In 2020, the average value was $4,060 per acre.
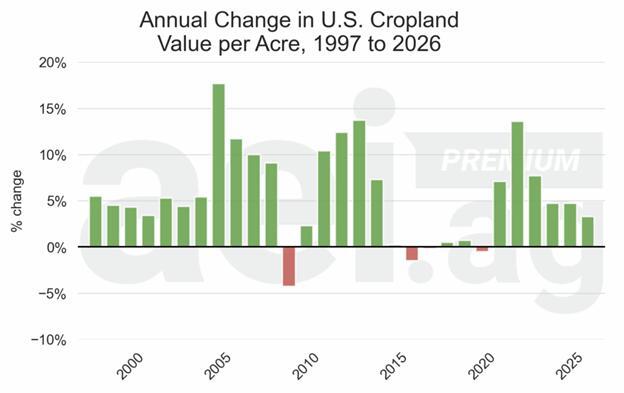 Figure 2. Annual change in the value of U.S. cropland, 1997 to 2026. Data sources: USDA NASS and AEI.ag calculations.
State-level changes
For most Midwestern states, cropland values increased near or ahead of the national average (3.3%). Nebraska was a bit of an exception, with values increasing only 2.4%.
Outside of the Midwest, Arizona (+1.8%) and Washington (+1.7%) also had small gains. Notably, inflation across the U.S. economy has been running between 2% and 3%. The implications are that inflation-adjusted values were lower in 2026.
At the other extreme, Florida (+5.2%) and Tennessee (+5.8%) posted the biggest year-over-year increases.
While the national picture is a slowdown, conditions were uneven across states. From Tennessee to Washington, the stories are quite different.
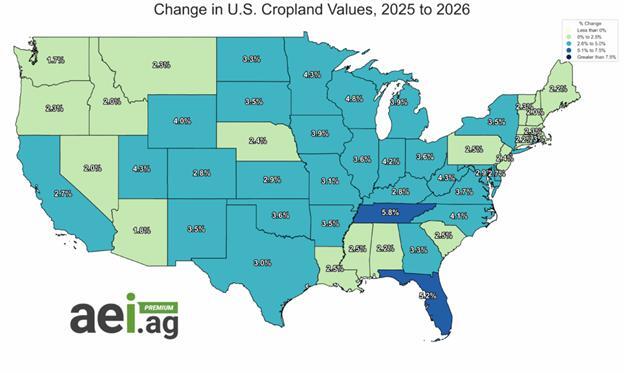 Figure 3. Annual change in state-level cropland values, 2025 to 2026. Data sources: USDA NASS and AEI.ag calculations.
Wrapping it up
Despite the headwinds, the USDA’s survey and methodology show cropland values continuing higher. Admittedly, the appreciation was the slowest in six years.
The national average, however, masks considerable variation. Cropland is driven by the local market, and national trends don’t describe what is happening across all regions.
EDITOR’S TAKE:
We often discuss the importance of land values as a measure of farm/ranch wealth. As I have stated before, there is an old saying, “farmers live poor and die rich”, which is a direct reference to the value of their land.
This article clearly demonstrates how land values have increased at the national/aggregate level but conceal some state-by-state variations. Nevertheless, farmland values continue to show strength for the farm/ranch balance sheet. Farm/ranch customers have solid equity on the books which, in most instances, makes them a worthy credit risk.
Speaking of credit, CAD members have a great program that can help with financing farm/ranch trucks and other purchases – it’s called CADFI. This is a special financing tool that allows you to customize payments to match farm income streams, be it monthly, quarterly, semi-annually or annually. Not familiar with it? Check it out at www.certifiedagdealer.com!