


Seventy-two percent of Americans would experience financial difficulty if their paychecks were...

The USDA’s latest data reveals a continued case of the haves and have-nots across the farm economy. While a lot can – and will – unfold over the next year or so, early indications suggest farm profitability will vary greatly by commodity and geography.
Enterprise differences
Within the livestock sector, most operations will have net cash income above the average observed during 2010-2016 (Figure 1). Strong profits are still unfolding for cattle producers, where the index value is 171– meaning cash incomes are 71% above the average. Conditions were also favorable in 2025 at 43% above the average. Again, 2026 profits are not guaranteed, but early estimates indicate that favorable conditions will likely persist.
Dairy incomes are expected to decline in 2026 (135), but it would be the third consecutive year with an index value above 130.
For hog producers, conditions remain higher than the 2023 lows (index value of 51), but profits haven’t been strong since 2021. Among livestock producers, hog profits have been the most challenging.
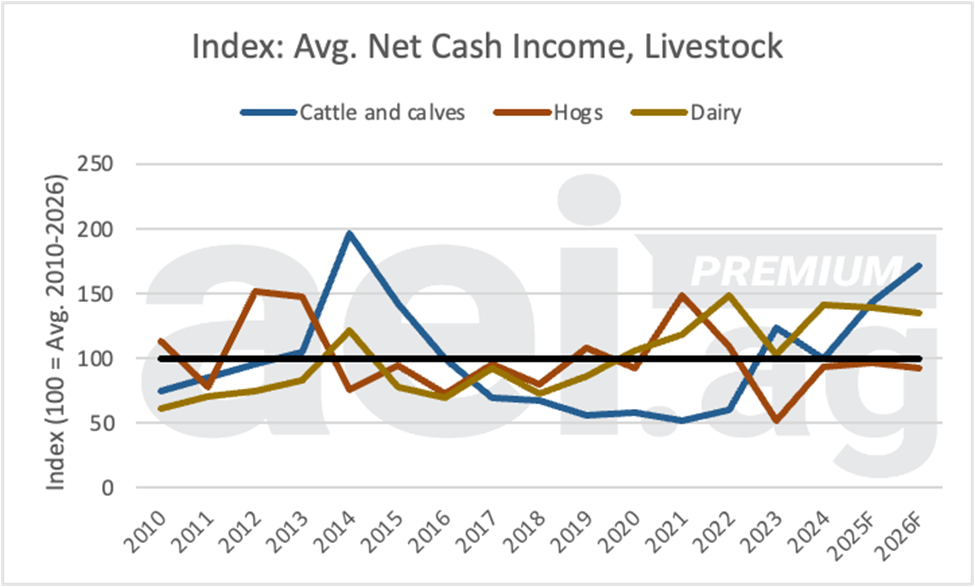
Figure 1. Index of average net cash income for select livestock operations, 2010 to 2026. Data source: USDA ERA and AEI.ag calculations.
The 2026 outlook remains challenging for most crop producers. For corn and soybeans operations, the index fell to a decade low in 2025 to 60 (corn) and 69 (soybeans) (Figure 2). In 2026, profits are expected to increase (83 for corn, 90 for soybeans) but will remain below the long-run average.
Keep in mind that these projections include returns from planting and harvesting crops, as well as government payments received (FBA and ARC/PLC). Most of those payments stem from 2025 production challenges. The implications are that cash flow will likely improve in 2026, but it’s not clear that profits from production have improved year-over-year.
The government payments situation is most obvious with wheat conditions. First, wheat stands to benefit from a large PLC payment, potentially as much as $1.45 per bushel. Second, wheat has an FBA payment of $39 per acre, which is a large share of revenue relative to corn payments ($44 per acre) and soybean ($31 per acre). Again, these payments will not affect producer budgets or their decisions about which crop to plant, but they do improve cash flows.
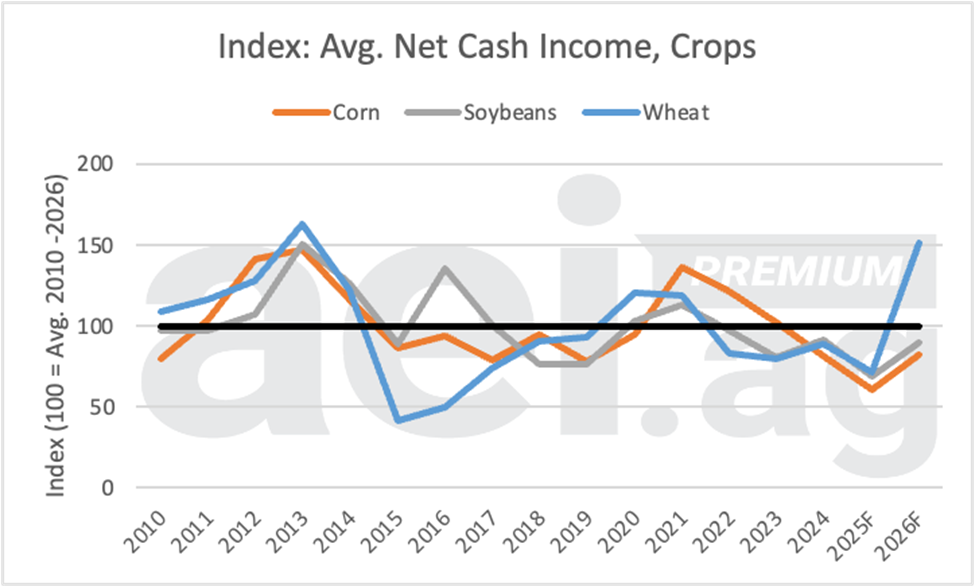
Figure 2. Index of average net cash income for select crop operations, 2010 to 2026. Data source: USDA ERA and AEI.ag calculations.
Geography
Unsurprisingly, profitability varies considerably across regions, aligning with prevailing crops and livestock. Figure 3 shows average farm net cash income for select USDA ERS regions.
Returns in the Heartland region remain low. In 2025, incomes were 74% of the long-run average, the lowest observed value. Conditions in 2026 will improve (index value of 89), but the situation is reminiscent of the 2017-2020 period, when the index remained below 90.
In the Northern Great Plains, conditions have been favorable in recent years. A large portion of those returns have come from strong cattle profits.
Lastly, the Prairie Gateway, which includes the Southern Plains states, will see a significant turnaround in 2026. More specifically, the index is projected to jump from 77 in 2025 to 121 in 2026, largely driven by wheat’s story from Figure 2.
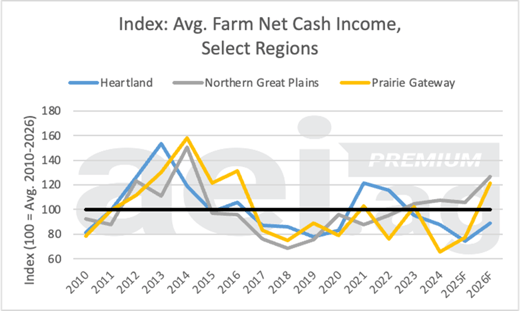
Figure 3. Index of average net cash income for select crop operations, by select regions. 2010 to 2026. Data source: USDA ERA and AEI.ag calculations.
Wrapping it up
It’s always difficult to summarize conditions across the farm economy, but the task has been even more difficult in recent years. At the enterprise level, conditions have been favorable for cattle and dairy operations but challenging for corn and soybeans. The timing and some magnitudes of government payments are projected to increase wheat producers’ 2026 cash income.
Those commodity-level differences play out across geographies as well. Financial stress is likely greatest across the Heartland region, where several years of cash income well below the long-run average are starting to compound. On the other hand, conditions in the Northern Great Plains have been strong in recent years. These differences can provide helpful context when sorting through various Federal Reserve reports on financial conditions or farmland survey activities.
EDITOR’S TAKE:
Overall, it appears things are going to remain solid for most livestock producers, and crop producers will see some improvement in 2026. While it may not be 100% for crop producers, it will certainly help ease the challenges they have faced this past year. And, who knows, with a new agreement in place for Chinese purchases, things could turn around dramatically.
One CAD program that can help you sell more trucks in good times and not-so-good times is AgPack®, which offers exclusive rebates and discounts that can be worth nearly $50,000 to that farm/ranch customer. It is also an excellent sales tool for you when selling against non-CAD dealers in your area. In 2025, the average AgPack redemption from farmers/ranchers was $19,172. That means, on average, they realized over $19K in savings simply because they purchased their truck from a CAD member. In my opinion, that equates to a very real sales advantage for you!


