The number of farms in the United States peaked in the mid-1930s before undergoing a steep decline...
Dairy Consumption Climbs to 64-year High

Dairy Outlook: U.S. consumers eat more cheese and yogurt now than in the 1950s, but they drink a lot less milk. U.S. dairy continues to be a growth category, both at home and abroad.
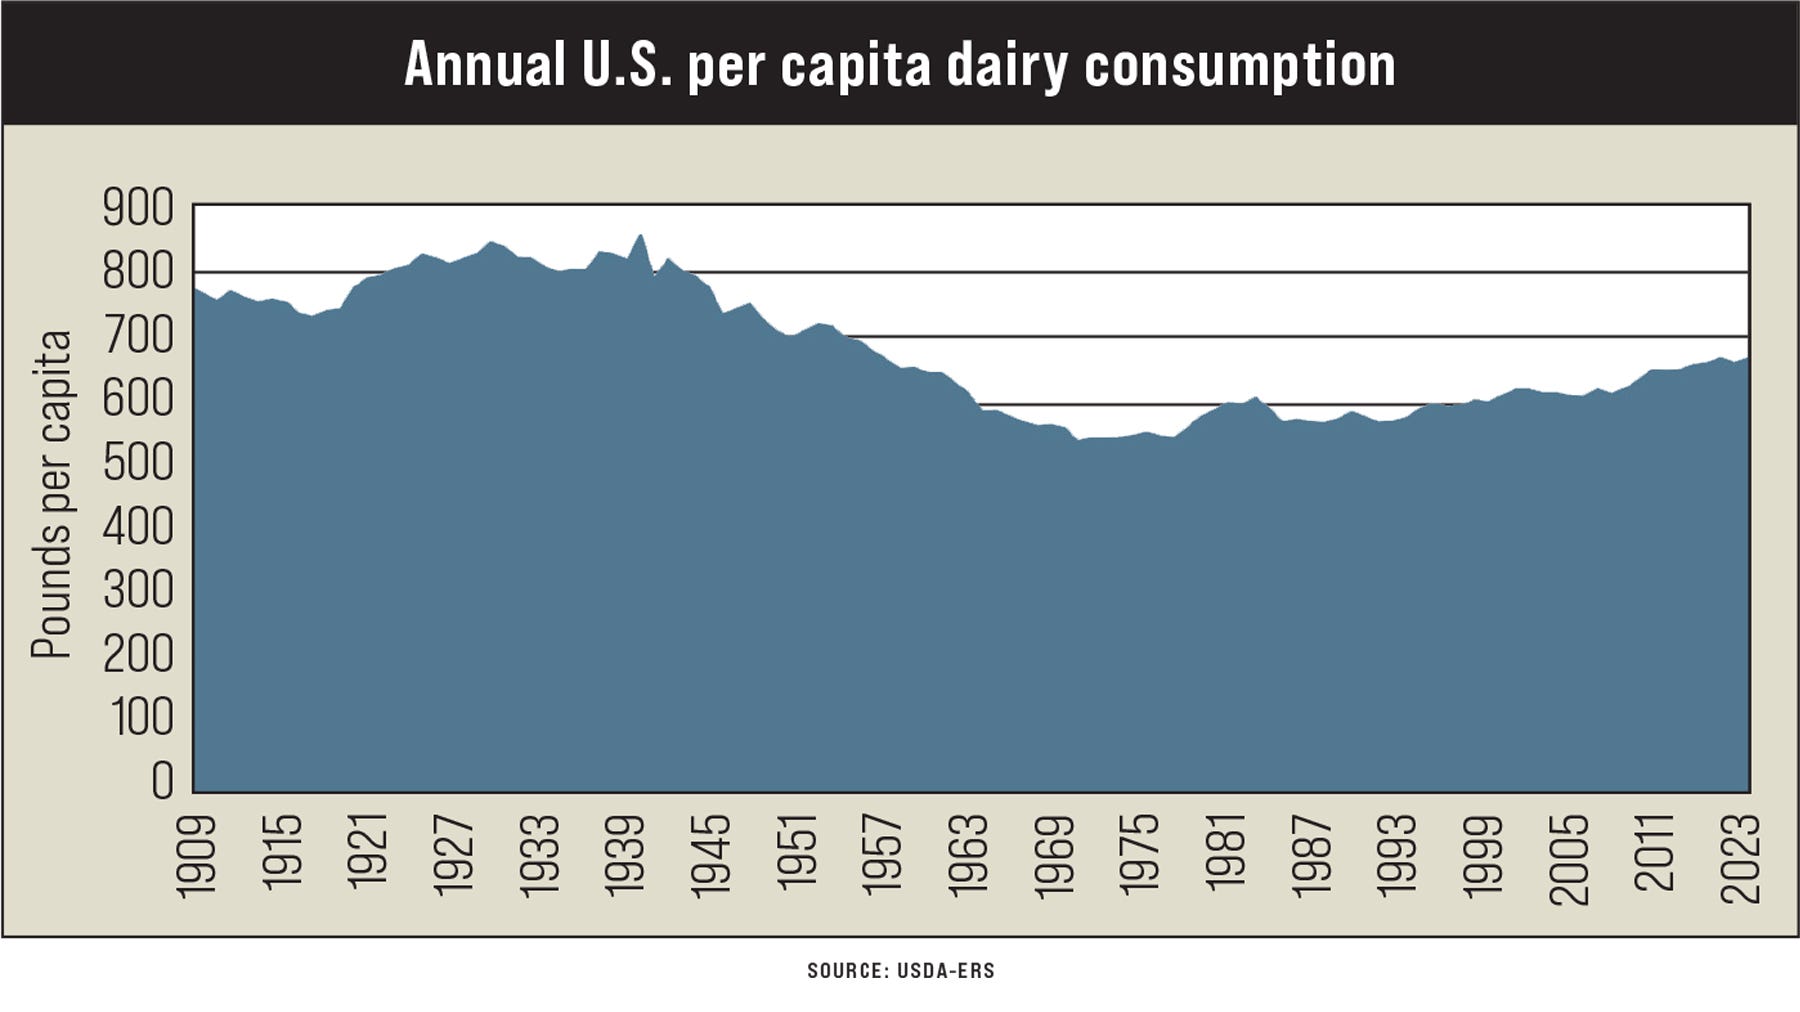
“Internationally, cheese and whey exports are bounding for record levels, and at home, Americans consumed 661 pounds of dairy products on a per capita basis in 2023,” says Corey Geiger, lead dairy economist for CoBank. That 2023 figure is reaching toward the highest level since 1959, according to data released in late November by USDA’s Economic Research Service. Back in those days, Americans consumed 672 pounds of dairy products as measured on a milkfat, milk-equivalent basis.
While consumption levels are similar in the 1959 and 2023 comparison, the dairy product mix today looks far different, Geiger notes. Consumers in the 1950s drank a lot more milk than they do today.
Cheese, please
“These days, cheese is the belle of the dairy ball,” Geiger says. In 2023, cheese posted its third straight record as the average American ate 40.5 pounds. Outside of the 2020 pandemic year, cheese consumption has posted annual records dating back to 2011.
Like the overall category, cheddar consumption hit a new benchmark when Americans ate a record 11.83 pounds per capita in 2023, Geiger notes. Despite slipping from its 2022 record, mozzarella still topped the cheese leader board at 12.45 pounds. While down slightly in recent years, the leading pizza cheese has bested cheddar for 14 straight years.
Cheese has been on a remarkable run for multiple generations. In 2002, per capita cheese consumption passed the 30-pound threshold for the very first time. Just 18 years earlier, it surpassed the 20-pound ceiling.
“Back in 1959, U.S. consumers ate just 8 pounds of cheese,” Geiger explains. “In those days, beverage milk was the first purchase in the dairy aisle, with fluid milk consumption at 297 pounds per capita and fluid cream at 7.5 pounds. Fast-forward to the present, and fluid milk sales have slid to a meager 128 pounds … that’s the lowest point in USDA’s data set dating back to 1909. USDA no longer tracks fluid cream, instead rolling it into the overall fluid category.”

On the surface, one would surmise that fluid milk still leads the dairy case. However, that’s where dairy-product conversions are necessary, Geiger notes. In 2023, 100 pounds of milk yielded 11.24 pounds of cheese. That means the natural cheese category accounted for 360.7 pounds of dairy product consumption on a milk-equivalent basis.
Butter is back
Butter is another product that has seen a remarkable resurgence.
“Butter peaked at 18.7 pounds per capita way back in 1911 … in an era prior to refrigeration, and butter allowed Americans to store a stable food product throughout the long winter,” Geiger explains. “After that peak, butter stayed above double-digit sales through 1950. Then competition from margarine and the heart-health hypothesis further eroded butter sales. Butter hit the sales cellar in 1997 at 4.2 pounds.”
Then new scientific research began suggesting that saturated fats were important to human diets. Consumers began to respond, and per capita sales moved to 6.5 pounds — the highest sales total since 1965, when Lyndon Johnson was in the White House, according to Geiger.
“On a milk-equivalent basis, it took 130 pounds of milk to make butter for the average American in 2023, as each 100 pounds of milk yields 4.98 pounds of butter,” he says.
Despite a slow downturn in sales, ice cream remains an important dairy product category, with per capita consumption at 11.7 pounds for regular ice cream and 6.2 pounds for the low-fat and nonfat frozen ice cream category.
“While the low-fat ice cream is just 1 pound off its peak, regular ice cream had its heyday back in 1975 at 18.2 pounds per capita,” Geiger says.
Dairy sales’ implications for farm
USDA also calculates how farm-gate milk is manufactured into dairy products. In 2000, 37.7% of the U.S. milk supply was manufactured into cheese, Geiger reports. That allocation grew to 42.2% in 2023. Butter experienced similar growth, from 16.3% in 2000 to 18% in 2023. These two categories use up nearly two-thirds of the U.S. milk supply on a milk-fat basis.
Farm-gate milk moving into the beverage category and frozen dairy products has been on a steady decline. In 2000, fluid milk used 18% of the milk supply; by 2023, that number was nearly halved at 10.1%. Frozen dairy products fell from 11% in 2000 to only 6.5% in 2023.
Yogurt is one other dairy product that deserves mention. In 2023, Americans ate 13.8 pounds per capita of the high protein dairy product.
“While an impressive figure, that metric is off about 1 pound from 2014’s 14.9-pound record,” Geiger notes. “That being said, yogurt is poised to be a growth category, as Americans are demanding high-protein foods, and the dairy product is now being introduced into more snacking bars and other on-the-go products.”
Cottage cheese has seen a resurgence in recent years, with Americans eating 2.1 pounds per capita in 2023. However, that’s off from the 1972 high watermark of 5.3 pounds.
EDITOR’S TAKE:
The dairy sector is a perfect example of how farmers and processors adapt to changing consumer preferences. Yesterday’s mix was more fluid milk oriented, but today, as the article points out, cheese is the new king of dairy. By making these adjustments and changing pricing policy for dairy, the industry is thriving once again. Be sure to put dairy farmers at the very top of your customer prospect list. They use and purchase a lot of trucks for their operation. And, the family typically has that SUV to take the family out to dinner or a movie. Be sure to keep your inventory on AgTruckTrader.com®!


