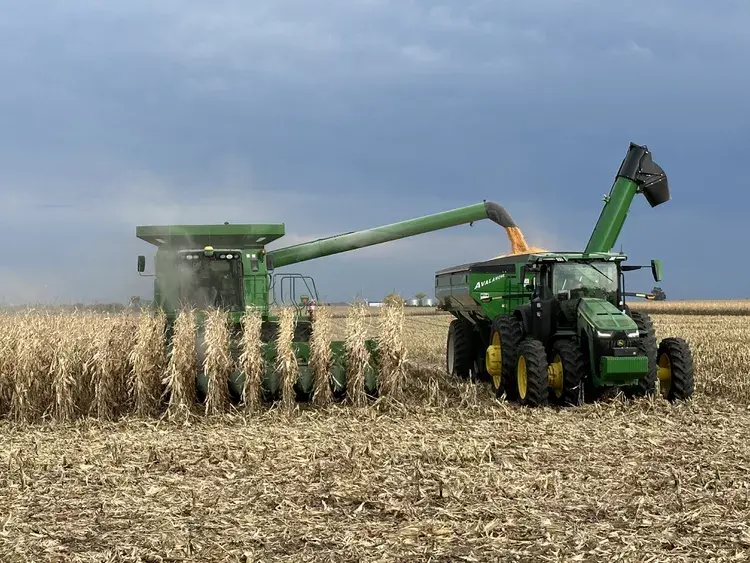
The National Corn Growers Association (NCGA) recently released its economic outlook for 2026...
Corn’s Dramatic Shift West Continues

The USDA’s latest estimate is that U.S. farmers planted more than 98m acres of corn in 2025, the largest planting in nearly nine decades. In recent memory, 2025 acreage surpassed the 2012 high-water mark of 97.3m acres (Figure 1).
National statistics rightfully capture headlines, but the most valuable insights are often found at the state and county levels. Specifically, the largest corn crop in decades didn’t translate into record acreage in all corn-producing states.

Figure 1. U.S. planted corn and soybean acreage, 2010 to 2025. Data sources: USDA NASS
Corn’s acreage shift
Comparing state acreages in 2025 with the other big corn years of 2012 (97.3m) and 2023 (94.6m) shows corn acreage has been moving west. Between 2012 and 2025, the biggest gains occurred in Kansas (+2.15m) and North Dakota (+1.06m) (Figure 2). Notably, acreage increased throughout the Great Plains states and across most of the southern United States.
On the other hand, the I-States and eastern Corn Belt lost corn acreage. Illinois and Indiana stand out, planting a combined 2.5m fewer corn acres.

Figure 2. State-level change in planted corn acreage, 2012 to 2025. Data sources: USDA NASS
Given the 13-year span, one could dismiss Figure 2 as old news. However, Figure 3 shows that the shift west has been persistent, even in recent years. Between 2023 and 2025, the U.S. planted an additional 4.1m acres, a 4% increase. Once again, the majority of those gains occurred in the northern and central Great Plains.
There was no meaningful increase in corn acreage across the eastern Corn Belt states, including Illinois and Indiana. Ohio stands out as it reduced acreage by 200,000 acres.
One could also argue that corn acreage is shifting south, with both Louisiana and Mississippi increasing their corn acreage.

Figure 3. State-level change in planted corn acreage, 2023 to 2025. Data sources: USDA NASS
When national acreage increases within just a few years, it’s natural to expect – or assume – that the rising tide increased acreage across all states. Admittedly, there are always survey errors or prevented-planted factors that can make the data noisy, but state-level trends reveal that corn acreage has continued its persistent move west. That shift is even noticeable since 2023.
Acreage trends often unfold like the frog in a pot of water – hard to notice in the moment, but significant over time. Triangulating year-over-year changes with regional shifts isn’t easy to spot in the data, which is why a closer look matters.
EDITOR’S TAKE:
The implications of these trends and changes are far-reaching. Lenders in the Great Plains are likely getting requests for larger operating lines of credit due to corn’s high variable costs. Territory or market trends will vary considerably for input retailers and manufacturers. Grain buyers in 2025 will also face very different supply scenarios in the Great Plains states (large acreage and high yields) compared to the Eastern Corn Belt.
It is always good to point out that corn is the most widely grown commodity in the U.S. However, as the article points out, this masks the reality that where the corn is being produced has and continues to be shifting further west and south. Part of this expansion is being driven by the growth in ethanol use/sales. Some by shifting patterns in the livestock and dairy sectors. Some of it is purely economic rationale. But no matter the reason, corn is likely to be an important crop in your area. You might want to take a closer look at what is happening and how any changes will impact your truck sales going forward. If you need some help getting the statistics you desire – give us a call, we can help get you started on the right track.


